๐Ÿ›ฐ๏ธ Live ยท Ireland ยท Sentinel-2 Satellite Data

Know what's growing across Ireland's tillage fields โ€” before you visit the farm

Cube Earth helps agricultural organisations understand what's growing, monitor crop development, and prioritise field inspections across Ireland using satellite imagery and AI.

Monitor every mapped tillage parcel in Ireland from a single interface.

61,566
Parcels mapped
77.05%
Balanced accuracy
18.1%
Parcels flagged for review
๐ŸŒพ 61,566 mapped parcels
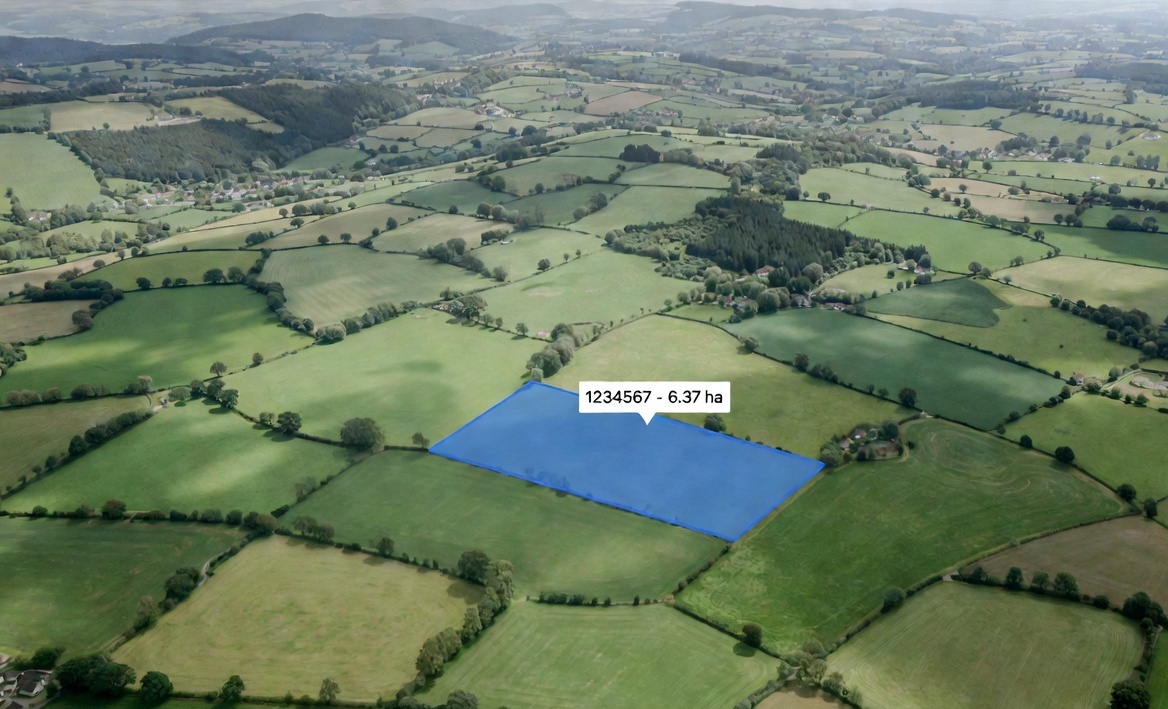
Cube Earth tillage field parcels
Open the Live Map โ†’
๐Ÿ›ฐ๏ธ
HLS Satellite
โ†’
๐Ÿค–
Crop Prediction
โ†’
๐Ÿ“
Parcel Intelligence
โ†’
โš ๏ธ
Differences Identified
โ†’
๐Ÿ“„
Field Intelligence Report
4 years
Satellite history (2022โ€“2025)
8
Tillage crop types classified
Free
HLS (Sentinel-2 + Landsat) open data
~5 day
HLS revisit (cloud-dependent)

From satellite to field report in three steps

No sensors, no farm visits, no manual surveys โ€” just publicly available European satellite data, analysed at parcel level.

1

Satellite imagery

Every 5 days, ESA's Sentinel-2 and NASA's Landsat satellites capture optical imagery of every field in Ireland. We track vegetation indices (NDVI, EVI, NDWI, NDRE, NDII) across the full growing season.

2

Machine learning classification

A model trained on 4 years of historical growth patterns estimates the most likely crop type from its seasonal growth pattern โ€” how it greens up, peaks, and senesces.

3

Verification & alerts

We compare our crop predictions with LPIS declarations, highlight differences for review, estimate growth stage, and provide harvest timing insights โ€” all within an interactive parcel map.

Field-level intelligence, not just a map

Click any parcel to see a full breakdown โ€” not just a crop label.

๐ŸŒพ

Crop classification

Spring/Winter Barley, Wheat, Oats, Maize, Rye โ€” accompanied by a calibrated confidence score, not a black-box guess.

โš ๏ธ

Declaration verification

Every parcel compares satellite detection against the farmer's LPIS declaration, flagging disagreements for review.

๐Ÿ“ˆ

Growth stage tracking

From germination to harvest, estimate where a crop sits in its growth cycle right now.

๐ŸŒฟ

NDVI vegetation health

Season-long vegetation index history for every field, updated as new satellite passes arrive.

๐Ÿ“…

Harvest window estimates

Estimated harvest window based on crop type and seasonal development.

๐ŸŒฆ๏ธ

Weather integration

7-day rainfall, temperature and wind forecasts overlaid on every field, in context.

๐Ÿ›ฐ๏ธ

Parcel-level analysis

Every mapped LPIS parcel is analysed individually using HLS satellite imagery โ€” not county or regional averages.

Built to be nationwide, transparent, and field-specific

๐Ÿ‡ฎ๐Ÿ‡ช

Nationwide coverage

Analyse over 61,000 mapped tillage parcels across Ireland, not a sample region.

๐Ÿ›ฐ๏ธ

No hardware required

Built entirely on freely available HLS (Sentinel-2 + Landsat) satellite imagery โ€” nothing to install.

๐Ÿ”

Transparent AI

Every prediction includes a calibrated confidence score โ€” no black-box outputs.

๐Ÿ“Š

Field-level insights

Explore parcel histories, growth stages, and weather in one place.

๐Ÿ“ˆ

Built for scale

Designed to monitor thousands of fields simultaneously, not one at a time.

Find parcels where satellite evidence differs from LPIS declarations

Government schemes check whether a required action happened. Cube Earth asks a different question: does the satellite evidence support the declared crop? Across all 61,566 parcels we've analysed, satellite detection disagrees with the LPIS declaration for a meaningful share of fields, some at high confidence.

This matters for grain buyers verifying supplier claims, for insurers assessing risk, and for anyone who needs independent, field-level evidence that can help prioritize inspections.

18.1%
Predictionโ€“declaration differences
81.9%
Confirmed matches
Example โ€” Parcel 54000
Satellite Detection๐ŸŒฝ Maize ยท 100%
LPIS Declaration๐ŸŒพ Spring Barley
Statusโš ๏ธ Mismatch flagged
RecommendationGround verification recommended

We show our confidence โ€” and our limits

Every prediction includes a calibrated confidence score. We'd rather tell you what we don't know than hide it. High-confidence predictions are more reliable than low-confidence predictions and should be interpreted accordingly.

โœ… What we've validated

  • 77.05% balanced accuracy nationally, tested on held-out data
  • Confidence scores calibrated โ€” 80% shown means ~80% actually correct
  • Tested against multiple alternative approaches during development, including C-band and L-band SAR fusion (Sentinel-1 and NISAR) and higher-resolution optical imagery. For this project, HLS optical data (Sentinel-2 and Landsat combined) delivered the best validation performance

โš ๏ธ Known limitations

  • Spring cereals (Barley/Oats/Wheat) are harder to tell apart from each other than from Maize or Winter crops
  • Confidence below ~50% means genuine uncertainty โ€” treat as a starting point, not a verdict
  • Currently covers tillage crops only โ€” no grassland or livestock land use yet
  • Growth stage and harvest windows are model estimates, not field-verified dates
  • Satellite observations are affected by cloud cover; prediction confidence may decrease when limited clear imagery is available
๐ŸŸข
High (80โ€“100%)
Prediction is usually reliable.
๐ŸŸก
Medium (50โ€“79%)
Similar crops may also fit the satellite signature.
๐Ÿ”ด
Low (<50%)
Use as a prompt for further review, not as a conclusion.

Cube Earth provides decision-support information and should not be used as the sole basis for regulatory or contractual decisions without additional verification.

Built for anyone who needs field-level answers, without a field visit

๐ŸŒฑ

Agronomy consultants

Monitor client fields at scale between site visits.

๐ŸŒพ

Grain buyers

Verify supplier crop declarations before harvest, without relying on self-reporting alone.

๐Ÿ›ก๏ธ

Crop insurers

Independent evidence to support underwriting and claims review.

๐Ÿฆ

Agricultural lenders

Cross-check declared land use as part of loan and subsidy risk assessment.

๐Ÿšœ

Large farming enterprises

Monitor thousands of parcels from a single map, prioritising where to look first.

๐Ÿ›๏ธ

Government & researchers

Independent, field-level data to complement existing compliance systems.

Common questions

How accurate is Cube Earth?

77.05% balanced accuracy nationally, measured on held-out data not used in training. Confidence scores are calibrated so the displayed percentage reflects real-world reliability.

Can it identify every crop?

Currently we classify 8 tillage crop types (Barley, Wheat, Oats, Maize, Rye โ€” Spring and Winter varieties). Grassland and other land uses are not yet covered. Spring cereals are harder to distinguish from one another than from Maize.

How often is the map updated?

The underlying satellites revisit every ~5 days under ideal conditions; actual usable imagery depends on cloud cover. We reprocess as new clear imagery becomes available rather than on a fixed schedule.

Why does a prediction differ from an LPIS declaration?

A difference can mean the declaration doesn't match what's growing, or that our prediction is wrong โ€” it's evidence to prompt review, not a verdict. Higher-confidence differences are more likely to reflect a genuine discrepancy.

Built to fit different ways of working

Cube Earth is currently in early access. Pricing is being finalised โ€” get in touch to discuss what fits your organisation.

Explorer

Free map access and parcel lookup across all of Ireland's mapped tillage parcels.

Available now

Professional

Organisation dashboards, saved regions, exports, and ongoing monitoring for your specific parcels of interest.

Contact for access

Enterprise

API access, bulk parcel analysis, and custom integrations for buyers, insurers, and large organisations.

Contact for access

Contact us โ†’

Why we built this

Agricultural organisations often rely on declarations, manual inspections, or fragmented datasets to understand what's happening across thousands of fields. We built Cube Earth to provide an independent, parcel-level view using open satellite imagery, transparent machine learning, and confidence scores that make uncertainty visible instead of hiding it.

Get in touch

Questions about accuracy, coverage, or organisation-level access โ€” reach out directly.

saumitra@cubed-earth.com โ†’

Explore Ireland's tillage map

Free to use. No account required to browse the map.

Open the Live Map โ†’ Download Sample Report (PDF) โ†’